In #3 I compiled in the Arduino InfluxDB Client in order to write watch originated stats onwards into InfluxDB.
I'd like to play with also pulling some basic information though.
As a start point, I think it'd be good to be able to add a simple indicator of battery status - Charging, Discharging or Idle.
Docs on querying with the client library are here
| #5 | Make HTTP requests less frequently |
Activity
14-Jun-23 22:14
assigned to @btasker
15-Jun-23 07:49
OK, so the client library uses Influx's V2 API for queries - the query will need to be written in Flux.
The value should (obviously) mirror the value shown on my solar dashboard so we probably want to apply the same logic:
Query:
Value mappings: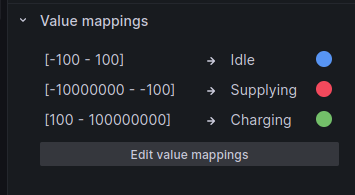
15-Jun-23 07:52
The Flux query is a little more complex than the InfluxQL version, in part because it also rolls in the logic used for the value mappings
Technically that logic could be applied in the calling code instead, but then we're using CPU cycles (and battery) on the watch when the far end can do it just fine.
15-Jun-23 07:56
So, we've got a query to run.
That's only part of the challenge though - if we want to add an indicator to the watch face we need to
Number 3's quite an important one - the 7Seg display is quite densely packed (at least, once you've done some steps).
One option - at least for proving the concept - might be to commandeer the areas used for weather information. It displays temperature and a sun/cloud/etc - that's all pulled from OpenWeatherMap so is approximately right. We could, technically, replace that with more specific information pulled from the Solar's information and my weather station.
15-Jun-23 08:12
I suppose, technically, if we really wanted to run InfluxQL we could just use
http.get()andJSON.parse()(like the weather code does) from the HTTPClient to craft a request and decode the response.15-Jun-23 13:50
mentioned in commit sysconfigs/watchy-code@5c0828e2dc9a4585a1ffb2383cc6b18cd961fed0
Commit: sysconfigs/watchy-code@5c0828e2dc9a4585a1ffb2383cc6b18cd961fed0
Author: B Tasker

Date: 2023-06-15T14:49:06.000+01:00
Message
Display proportion of locally supplied electricity (misc/watchy-experimentation#4)
This queries an InfluxDB instance (which may be different to the one that Watchy's stats are written to) to get and display what percentage of our power consumption was locally supplied (i.e. came from Solar or batteries)
Also adds a bitmap to be used as a percent symbol
15-Jun-23 13:51
I decided to use InfluxQL after all - means the watch can target an InfluxDB instance of basically any version and the query can be performed without the processing overhead of any additional libraries.
The meat and bones of this is
The bitmap for the percent symbol was created with Gimp and then converted with image2cpp
15-Jun-23 14:07
Currently, it won't cache the result - so if I wander out of wifi range the value should (I assume) disappear. Might be good to look at having it cache.
To make space, I sacrificed the temperature display.
It occurred to me though, that it should be possible to have the two alternate: if the minute is odd display this, if it's even, display the temperature.
15-Jun-23 16:19
mentioned in commit sysconfigs/watchy-code@eeb882597b9b3a6adc4391e27ff36917db190883
Commit: sysconfigs/watchy-code@eeb882597b9b3a6adc4391e27ff36917db190883
Author: B Tasker

Date: 2023-06-15T17:18:23.000+01:00
Message
Make display alternate between temperature and solar efficiency misc/watchy-experimentation#4
If the minute is an odd number, then during repaint we display the temperature reported by the weather service.
If it's even, we display the solar efficiency figure
16-Jun-23 07:59
mentioned in issue #5
16-Jun-23 07:59
marked this issue as related to #5
16-Jun-23 08:24
I'm going to mark this as done - there's a little bit of follow up to do, but I've raised #5 for that as it affects stuff done in other issues too.