I've been investigating an increase (trebling) of latency to my website reported by UptimeRobot.
The increase it shows doesn't appear in any of the other latency metrics I have, so I suspect it's probably on UR's side.
But, I thought it'd be interesting to look at building a platform which periodically runs a test, and then reports into a Cloud2 instance, with a Notebook used as a sort of status page
Activity
27-May-22 19:07
assigned to @btasker
27-May-22 19:07
assigned to @btasker
27-May-22 19:08
My current line of thinking is to use AWS's Elastic Container Service to run a batch task periodically.
That task will be to run Telegraf with something like
So that it runs its checks, reports in and then exits.
27-May-22 19:44
OK, after a bit of fiddling around, I think I've got the beginnings of this.
In Cloud2, created a telegraf config to request against my sites
In AWS, went into Elastic Container Service and created an ECS cluster (equipped with a single
t3.micro)Created a task
TelegrafWebsiteMonitorand added a container to it with the following settingstelegraf:latesttelegraf,--once,--config,https://eu-central-1-1.aws.cloud2.influxdata.com/api/v2/telegrafs/<blah>INFLUX_TOKEN: [my token]I should probably have used secret storage for the token, but that'll do for now.
Running the task works
27-May-22 19:47
So, we've got minimum viable product, what we need to work out now (well, tomorrow probably) is
t3.microwith telegraf on?)Might also be interesting to look at whether we can achieve similar with Google Cloud Run
27-May-22 19:58
Figured I'd schedule some runs before wandering off and enjoying Friday night.
Following the docs to schedule with Eventbridge
I defined a rule using type schedule
Then set the schedule as every 5 mins
Then defined the target as
ECS taskIt looks like the rule first on creation, as I got a datapoint at 19:52 UTC - be interesting to see whether the next is then 19:57 (5 minutes after start, so every 5 minutes) or at 19:55 (so at each 5 minute). I assume the former.
Every 5 minutes it is then
27-May-22 20:06
Quickly then, creating a note book
Created an API token
Build a notebook
28-May-22 07:57
So that's working
I want to get it to declare it's region now though, so adding the following to the Telegraf config in cloud:
Created a new revision of the task specifying a container with
telegraf:latesttelegraf,--once,--config,https://eu-central-1-1.aws.cloud2.influxdata.com/api/v2/telegrafs/<blah>INFLUX_TOKEN: [my token]TEST_REGION: eu-westWhen I created the schedule, it was set to use the latest revision of the task definition, so in theory we should see that tag start appearing in Cloud.
28-May-22 08:10
And there it is
The query underlying each of those graphs is
So, the next thing to do would be to set exactly the same thing up again, in a different AWS region
28-May-22 08:37
Just going back to the billing though, it's probably worth seeing whether we can get this working with Fargate - that way you only pay for the time the container is running.
For comparison's sake, costs are
t3.micro: $0.0104/hr ($7.20 month)Data transfer rates aren't included, but are the same for both.
Working out Fargate pricing is obviously a little more complex...
Fargate bills to the second but has a 1 minute minimum, and we know we only need part of a vCPU. There's 20GB of storage baked in, we'll never need more than that for this.
If we assume
Then, we'd be billed for 12 minutes per hour:
That would make the cost of fargate
$0.0024684999999999998/hr ($1.777/month)28-May-22 09:08
So:
Go to Elastic Containers Service
Create cluster, "Networking only" (called mine FargateCluster)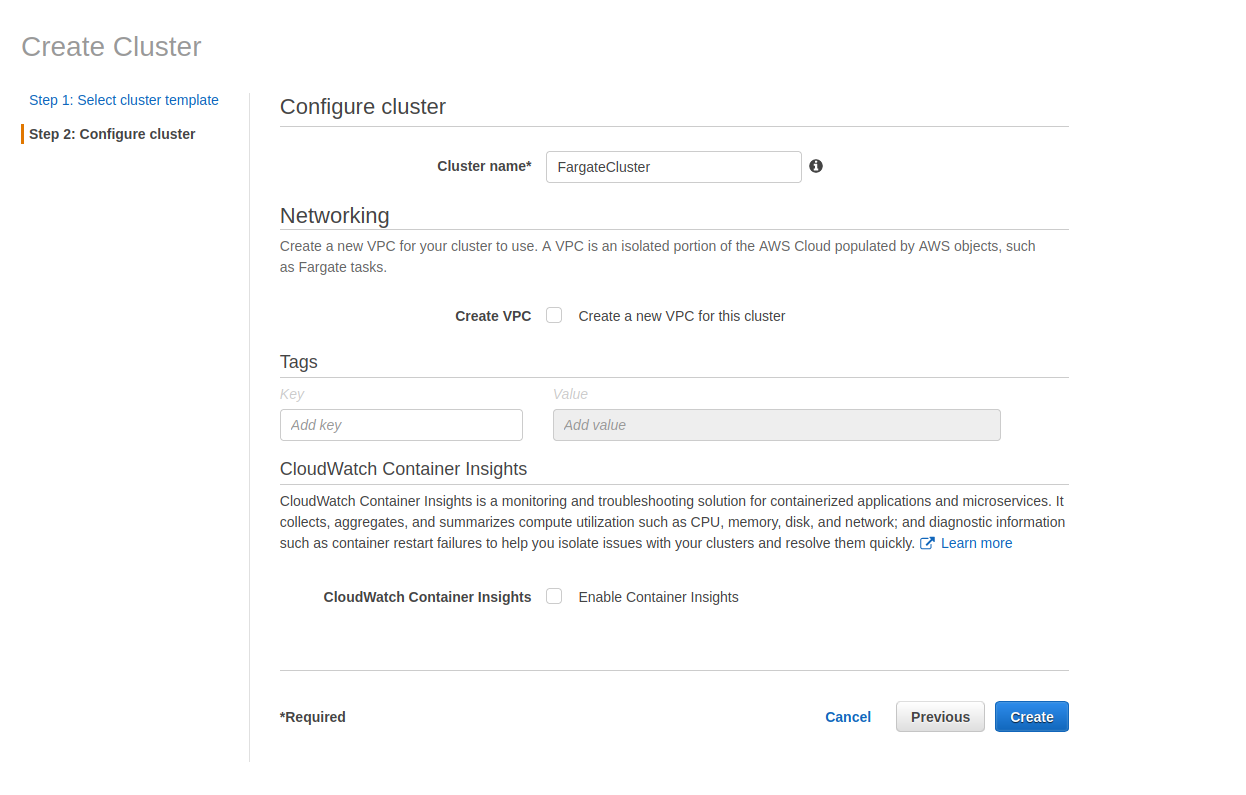
That's all the options there are....
Creating a new task definition
Creating the container
telegraf:latesttelegraf,--once,--config,https://eu-central-1-1.aws.cloud2.influxdata.com/api/v2/telegrafs/<blah>INFLUX_TOKEN: [my token]TEST_REGION: eu-westCreated and giving it a test run
It worked.
Next is scheduling it,
Scheduled TasksCreateI've disabled the schedule I created earlier so that the ECS based cluster is no longer running the task
The first run of the task has started
28-May-22 09:24
The fargate runs are reporting in happily, so I'm going to kill off the ECS cluster and associated stuff.
Note: deleting a cluster in ECS is unbelievably slow...
28-May-22 09:29
Next step then, is to switch region and see whether the runbook above gets me there.
I think we go for Eastern USA next - the UptimeRobot stuff that triggered this experiment in the first place was hitting a datacentre in that region, so it'll help get us towards replicating that.
28-May-22 10:09
It looks like the task scheduling works a little different in AWS Singapore: unlike other regions, the task doesn't run at time of first creation.
28-May-22 10:55
We can tabulate aggregate response time stats across regions with the following Flux query
28-May-22 15:36
I've documented this process here: https://www.bentasker.co.uk/posts/blog/general/website-availability-monitoring-with-telegraf-fargate-and-influxdb.html
27-May-22 19:07
moved from project-management-only/staging#3
04-Jun-22 11:03
mentioned in issue CDN#19
04-Jul-23 14:58
mentioned in issue CDN#57