Issue Type: issue
Status: closed
Reported By: btasker
Assigned To: btasker
Milestone: v0.2
Created: 05-May-23 07:40
Description
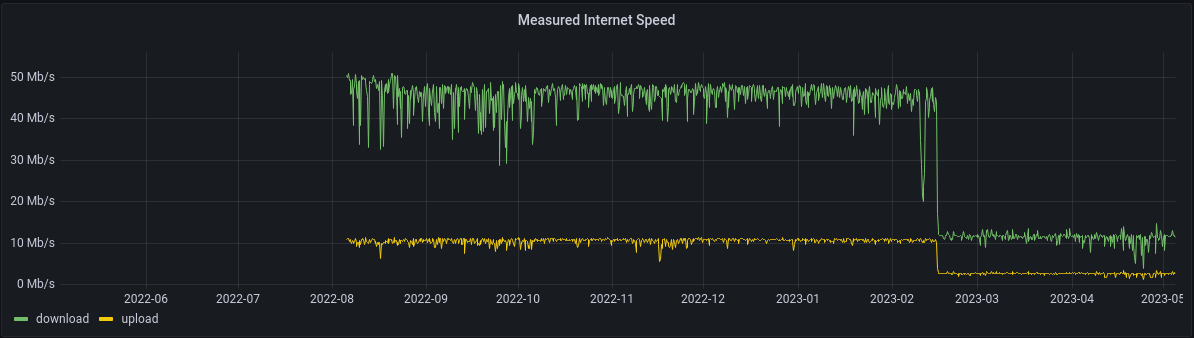
Whilst checking some historic graphs, I've noticed an odd skew in some of the historic data being generated by downsample.
The nature of the skew isn't consistent. For example, speed measurements for our internet connection seem to have skewed downwards by about 50%
The job for that is
downsample_mean_15m:
    # Name for the task
    name: "Downsample Various Means"
    influx: home1x

    # Taken from range()
    period: 45

    # Take from aggregate Window
    window: 15

    # taken from in_bucket
    bucket: telegraf/autogen
    measurement:
        - data_quota
        - http_response
        - i2pd
        - nextcloud_quotas
        - pihole_stats
        - internet_speed

    not_fields:
        - result_type
        - status

    # We want to generate each of the aggregates
    # and append the suffixes created in the map() calls
    aggregates:
        mean:
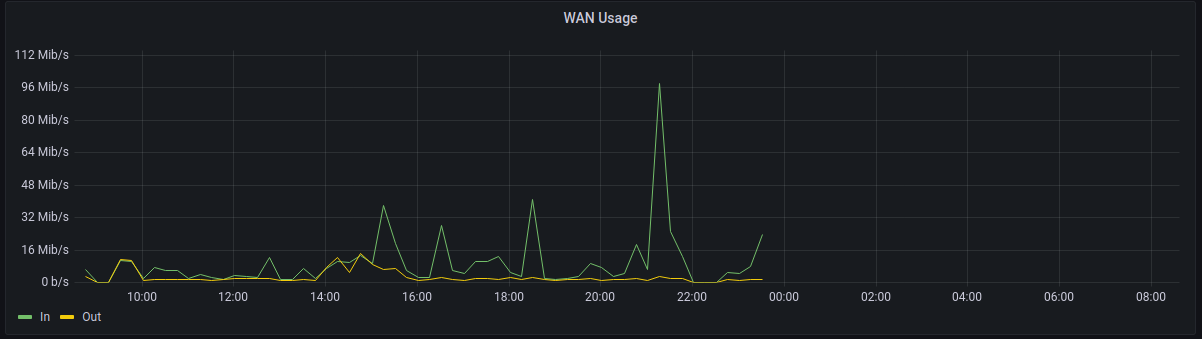
Meanwhile, though, the interface counters for our WAN interface seem to have skewed up
The job for those is
downsample_interface_stats:
    # Name for the task
    name: "Downsample OpenWRT Interface Stats"
    influx: home1x

    # Taken from range()
    period: 60

    # Take from aggregate Window
    window: 15

    # taken from in_bucket
    bucket: telegraf/autogen
    measurement: interface

    filters:
        - 'r.hostname == "OpenWRT"'

    fields:
        - ifHCInOctets
        - ifHCOutOctets
        - ifOperStatus
        - ifInErrors


    # We want to generate each of the aggregates
    # and append the suffixes created in the map() calls
    aggregates:
        mean:
    output_influx:
        - influx: home2xreal
    output_bucket: telegraf/telegraf_low_granularity
(That gap is because I tried changing the aggregate to max last night).
So in one graph, we're claiming that the connection only manages 25Mb/s, whilst in another we're claiming to have done 112Mib/s.
If I check raw data, both of these graphs give an expected result - around 50Mbps of internet speed with WAN usage generally a lot lower
Need to look into why
Activity
05-May-23 07:40
assigned to @btasker
05-May-23 07:41
changed the description
05-May-23 07:45
I think the issue with the interface statistics is just that the chosen means of downsampling is incorrect.
The underlying fields are cumulative counters - they show the total number of octets/errors etc since the router's networking stack last restarted.
Taking a mean of that and then later using
derivative()probably is going to cause unexpected results.What we should actually do, is have the downsample job use
derivative()so that the downsampled data represents the data rate rather than a view of the raw counter's state. It's quite possible that that alone will be enough to give the correct values.The internet speed check is a little harder - will need to look at the underlying raw data. Given the report is consistently about half though, I would guess that there are some low (like
0or1) values being taken into account and skewing the mean.05-May-23 08:30
We don't have
derivative()available as an aggregate (I guess it'd be a pre-processor really. Raised #26 to track) so we'll need to use a custom flux query:I've just given that a test run.
Querying with
currently gives a single datapoint: around 3Mbps.
Although that sounds like a realistic figure, it's not the value I'm getting from the raw data.
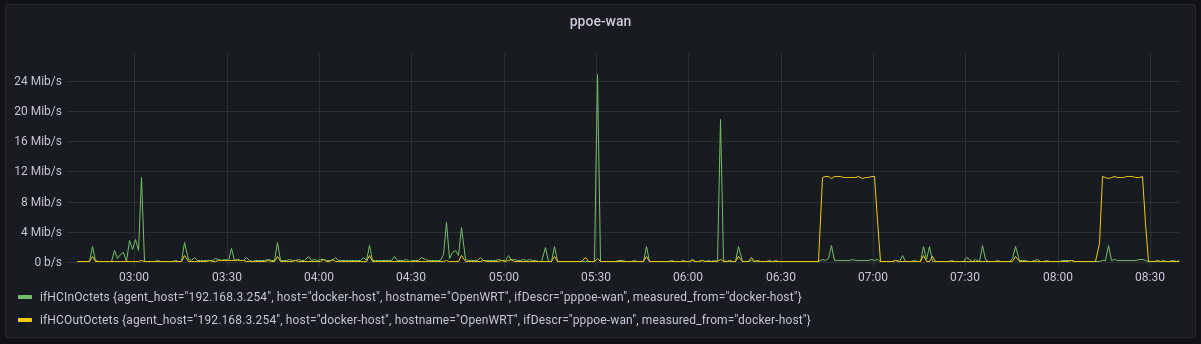
If we run the query that Downsample is running (but filter for
ppoe-wanto reduce noise), we don't get anything near that reading around 09:05Just for avoidance of doubt, if we add
to the query, we do not see the numbers skew up - they remain in the kbps range.
Going to the downsampled data then (we've gained an additional entry in the meantime):
We get
311417 bits per second is not 3Mbps, it's 311Kbps - so why is Grafana reporting that higher value?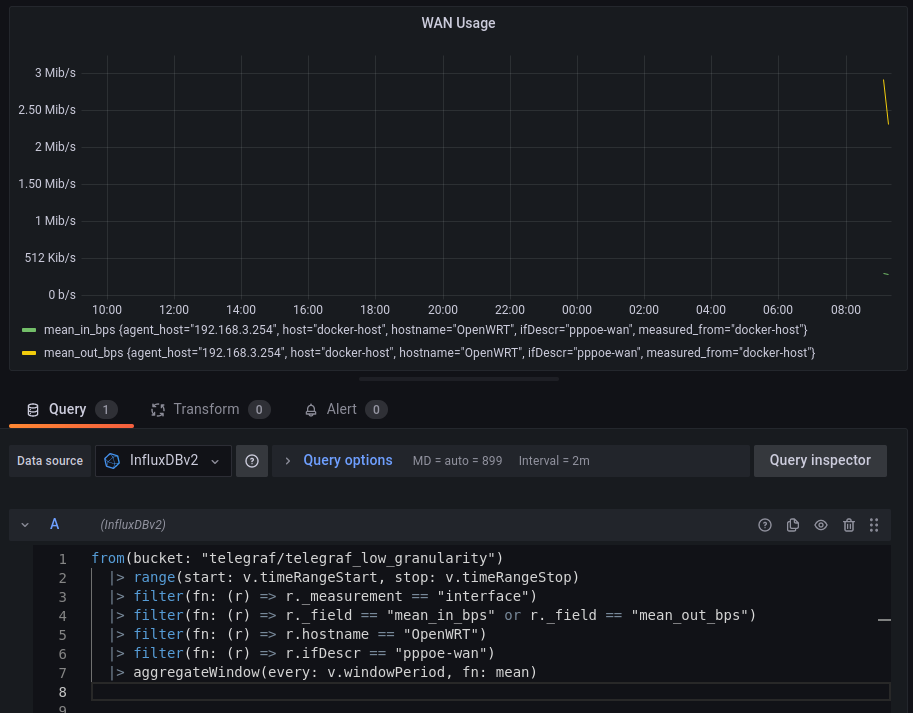
Actually,
mean_in_bpslooks about right, it's out we need to look at.In grafana,
mean_out_bpsclaims 2.9Mib/s. In the raw data above it's 3054988.8 bps (about 3MB/s).Querying the raw data with
Doesn't show anywhere near that level at 09:05
We see much the same with the most recent datapoint (09:15) too - in the downsampled data the out rate is claimed at 2.4Mbps, but raw data shows it as much lower.
Maybe I'm just tired, but I'm confused - this looks like it has to be a bug, and yet - why's it only affecting one field?
05-May-23 09:01
OK, so before we go hunting demons in the code, I'm pulling the raw data that the job should have got for this field (dropping some columns to improve readability)
It's the final window (table 4) that we care about in this case.
Values there are
So the mean that should be arrived at is (
125765.19998 / 6) = 20960.86666633 (so around 21kbps).Just for completeness's sake, checking the 08:15 window (it's a full window so has more values). Rounding out of laziness
Which when summed comes out at 297374. Dividing that by 15 gives 19824 (again, around 20Kbps).
So the data we're receiving is definitely representative of the values we're expecting to see.
If we look at
max_out_bpsfor08:15it's 11923583.2 - yet that value doesn't appear in the list of values above. It's like it's been taken from an entirely different source. What makes it weirder is, it's a float - so it's not even like it's a counter somehow slipping through.And again... why isn't it happening for the other field?
I wondered if perhaps the number was (somehow) spilling over from another interface so removed the interface filter when querying the full dataset
Got no results.
If I remove the field filter, I still don't get any results.
This value has to be coming from somewhere
As if it wasn't odd enough, the latest runs don't seem to do it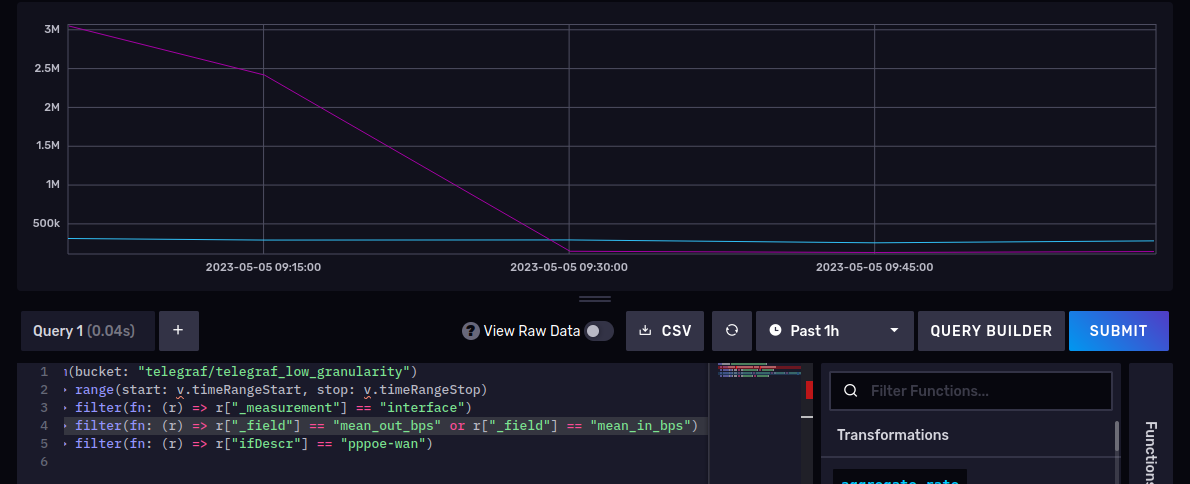
Going to have to keep an eye on it, but it's going to be hard to troubleshoot if it's no longer happening (it's also still quite possible the answer is that I'm confused).
05-May-23 09:02
I've added a graph to my Internet Connection dashboard to monitor this.
05-May-23 09:03
mentioned in commit sysconfigs/downsample_configs@8f8e707e5c0dfcb0b5f3ac6d49ce1c65657181e8
Commit: sysconfigs/downsample_configs@8f8e707e5c0dfcb0b5f3ac6d49ce1c65657181e8
Author: ben

Date: 2023-05-05T10:03:37.000+01:00
Message
Add downsample job for utilities/python_influxdb_downsample#25
08-May-23 08:55
The WAN speed graph is consistently returning correct values now.
So that one can be considered a config issue: calculating the mean of a cumulative counter gives unexpected results.
Need to look at the speed calculations next.
08-May-23 09:21
Broadband speed calculation
The last 24hrs downsampled vs raw
That data's downsampled as part of a broader job, built on the following query
(taken from the logged run I did earlier in the ticket - which is why timeranges are out).
So to make troubleshooting easier, we probably want to trim that back to
If I run that in Grafana quickly, we get an interesting set of results:
So if we take that first column, we've got a single value of 48.7, but we've got two rows. So, we'd calculate the mean as
48.7/2and effectively halve it.But, if we switch to using the Influx UI (draws better tables)
We can see that it might be a reporting issue.
Oddly though, if we add a
mean()call to it...So, we're probably 0'ing those empty windows, which then can factored into the means when graphing later.
We can prove that by querying the data out:
So there's the source of the skew. We can probably blame #20 for that.
08-May-23 10:20
There are two possible fixes for the broadband speed reports then:
window_create_emptytoFalseon the downsample jobThe correct answer is probably to do both (as it'll fix graphing of the data we already have, as well as correcting future downsamples).
It affects this job because the sampling interval is roughly the same as that of the windowing period, so you can end up with weird offsets.
Update:
Disabling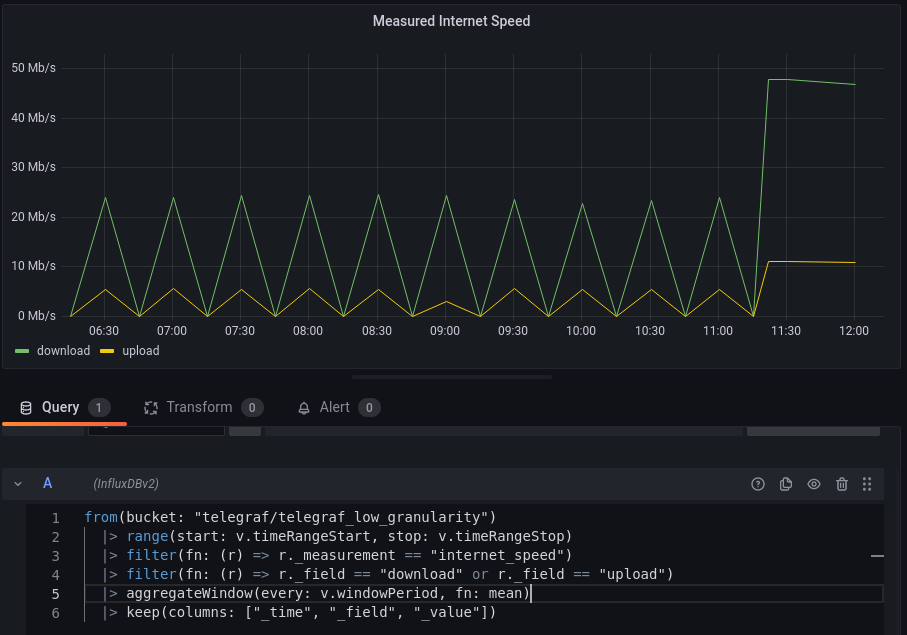
window_create_emptyhad the desired effect for new incoming dataWhilst adding a filter to strip the 0's corrected the historic data
08-May-23 10:28
mentioned in issue #27
08-May-23 11:10
So, as it turns out, these were both configuration issues.
Although they were valid things to investigate, closing as Invalid as they were not code issues
08-May-23 11:18
mentioned in commit sysconfigs/downsample_configs@874f0379a3995e398df0f1f0ba88220886c45e12
Commit: sysconfigs/downsample_configs@874f0379a3995e398df0f1f0ba88220886c45e12
Author: ben

Date: 2023-05-08T12:15:09.000+01:00
Message
Disable creation of empty windows
This was the fix in utilities/python_influxdb_downsample#25
With this enabled, we periodically insert a 0 value for internet speeds, which skews calculation of
mean()over time.08-May-23 11:27
mentioned in issue #20